Wootware Wootbook Ultra II
Performance Analysis
As with all things, the test is where the rubber meets the road. Below are performance figures comparing the out the box performance with my tuned settings. The benchmarks range from video encoding, games and of course the synthetic tests. Where applicable each of the results were verified using Benchmate. First up is PC Mark 10’s Extended and Storage test.
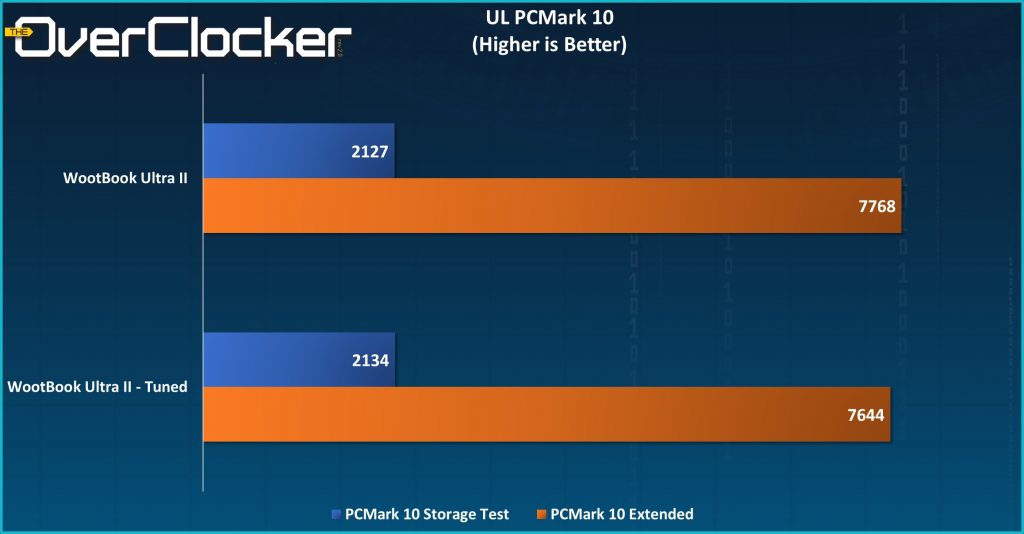
It may seem from the above graph that tuning the system leads to lower performance, but keep in mind that this difference in performance is negligible at best. Real world applications mostly favor the tuned setting. Storage results are consistent and well within the tolerable margin of error.
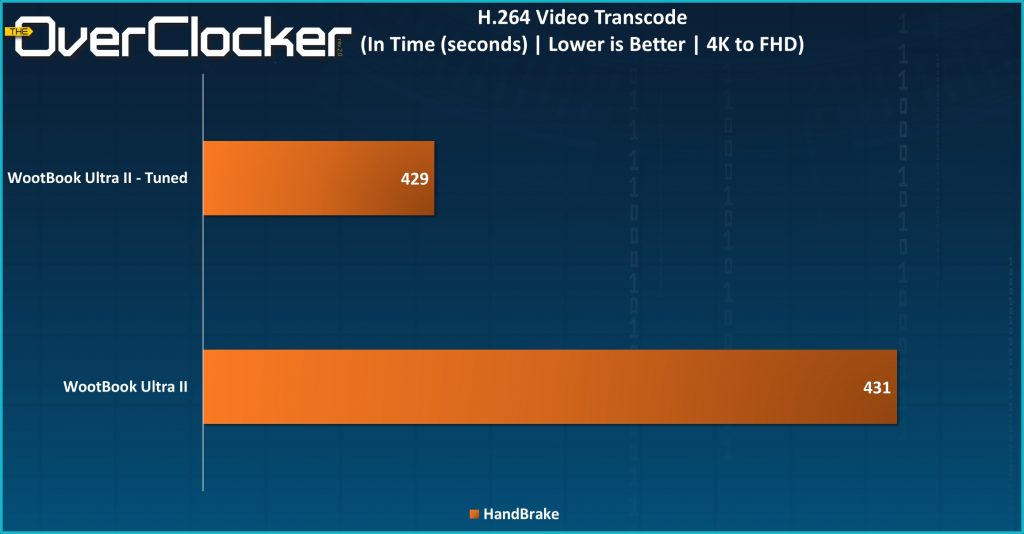
Video transcoding performance gives the nod to the tuned settings. Not by much, but realize that the tuned settings limit power draw quite drastically. Despite these limitations and lower peak CPU frequency, the increase in thermal headroom leads to a higher CPU frequency more consistently.
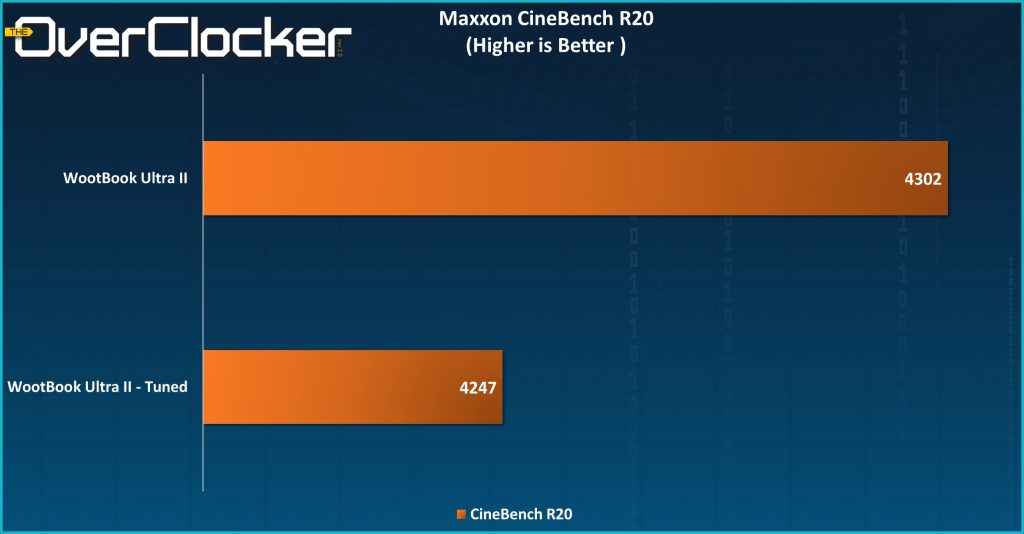
CineBench R20 is an interesting one because the results given to the un-tuned setting isn’t reliable. By that I mean, the clock frequency starts out high but before long, the performance throttling starts. Over a series of consecutive runs, the tuned settings deliver more consistent performance.